Millennial and Gen Z Veterans accounted for more than half of all VA purchase loans in a record year for this historic benefit program. Gen Z in particular is starting to make its presence felt in markets across the country.
Millennial and Generation Z homebuyers helped drive the VA loan program to a record year in Fiscal Year 2021.
The VA backed more than 1.4 million loans in FY21, eclipsing last year's previous all-time high by nearly 200,000 loans. VA purchase loans were up 3.6% from last year, marking the 10th consecutive year of annual increases. With rates still hovering near modern-day lows, refinance remained the story of VA lending this fiscal year.
But younger homebuyers continue to make their mark in a major way.
Millennial and Gen Z Veterans accounted for 52% of all VA purchase loans in FY21, a 6.6% increase from last fiscal year.
While Millennials represent the bulk of VA purchase lending, Gen Z in particular is starting to make its presence felt in markets across the country. VA purchase loans were up 84% year over year for this group.
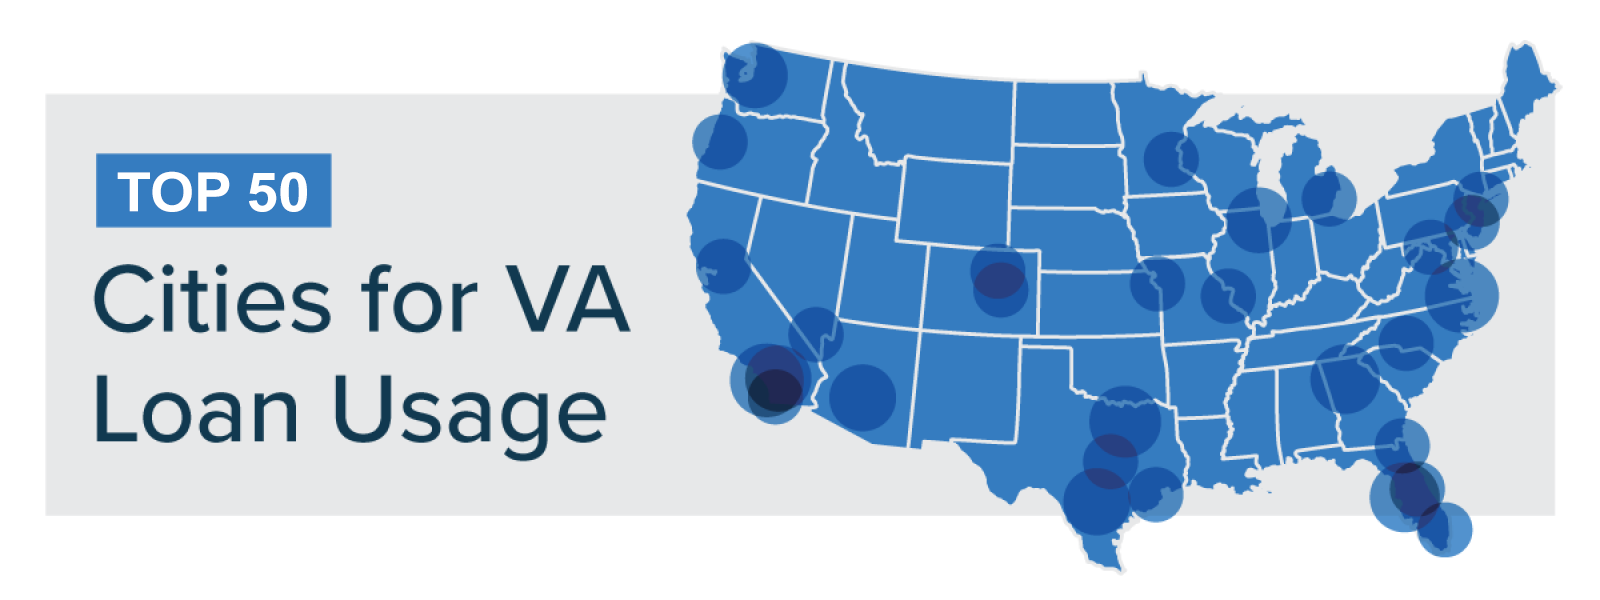
Key Takeaways for Top 50 Metro Areas
- Virginia Beach again topped the list for most VA purchase loans to Millennial and Gen Z Veterans (10,477), followed by Washington, D.C. (8,099), San Antonio (5,541), Colorado Springs (5,022) and Dallas-Fort Worth (4,515). The Top 5 were the same five cities as the previous two years, with Colorado Springs jumping ahead of Dallas this year.
- Nearly half of the Top 50 metro areas came from Texas (six), Florida (six), Georgia (five), North Carolina (four) and Washington (three).
- 22 markets saw a year-over-year increase of 10% or more, while seven markets experienced a 20%+ increase.
- Fayetteville, N.C., jumped four spots from last year to round out the Top 10.
Top 50 Cities for Millennial and Gen Z VA Buyers
| MSA | FY 2020 VA Purchase Loans | FY 2021 VA Purchase Loans | % Difference |
|---|---|---|---|
| Virginia Beach-Norfolk-Newport News, VA-NC | 8,532 | 10,477 | 22.8% |
| Washington-Arlington-Alexandria, DC-VA-MD-WV | 6,969 | 8,099 | 16.2% |
| San Antonio, TX | 4,919 | 5,541 | 12.6% |
| Colorado Springs, CO | 4,770 | 5,022 | 5.28% |
| Dallas-Fort Worth-Arlington, TX | 4,791 | 4,515 | -5.76% |
| San Diego-Carlsbad-San Marcos, CA | 4,368 | 4,308 | -1.37% |
| Houston-Sugar Land-Baytown, TX | 3,433 | 3,752 | 9.29% |
| Riverside-San Bernardino-Ontario, CA | 3,260 | 3,702 | 13.5% |
| Phoenix-Mesa-Scottsdale, AZ | 3,928 | 3,688 | -6.11% |
| Fayetteville, NC | 2,951 | 3,588 | 21.5% |
| Jacksonville, FL | 3,297 | 3,399 | 3.09% |
| Clarksville, TN-KY | 2,859 | 3,293 | 15.2% |
| Killeen-Temple-Fort Hood, TX | 2,786 | 3,278 | 17.6% |
| Atlanta-Sandy Springs-Marietta, GA | 3,130 | 3,232 | 3.26% |
| Jacksonville, NC | 3,034 | 3,187 | 5.04% |
| Seattle-Tacoma-Bellevue, WA | 3,138 | 3,141 | 0.10% |
| Baltimore-Towson, MD | 2,536 | 2,982 | 17.5% |
| Tampa-St. Petersburg-Clearwater, FL | 2,666 | 2,779 | 4.24% |
| Las Vegas-Paradise, NV | 2,466 | 2,722 | 10.4% |
| Chicago-Naperville-Joliet, IL-IN-WI | 2,473 | 2,721 | 10% |
| Pensacola-Ferry Pass-Brent, FL | 1,982 | 2,261 | 14.1% |
| Denver-Aurora, CO | 2,312 | 2,240 | -3.11% |
| Fort Walton Beach-Crestview-Destin, FL | 1,917 | 2,213 | 15.4% |
| St. Louis, MO-IL | 1,840 | 2,081 | 13.1% |
| Honolulu, HI | 1,651 | 1,975 | 19.6% |
| Augusta-Richmond County, GA-SC | 1,685 | 1,970 | 16.9% |
| El Paso, TX | 1,629 | 1,929 | 18.4% |
| Oklahoma City, OK | 1,843 | 1,821 | -1.19% |
| Los Angeles-Long Beach-Santa Ana, CA | 1,667 | 1,799 | 7.92% |
| Charleston-North Charleston, SC | 1,565 | 1,615 | 3.19% |
| Minneapolis-St. Paul-Bloomington, MN-WI | 1,594 | 1,584 | -0.63% |
| Kansas City, MO-KS | 1,413 | 1,504 | 6.44% |
| Columbia, SC | 1,271 | 1,492 | 17.4% |
| Savannah, GA | 1,173 | 1,479 | 26.1% |
| Tucson, AZ | 1,407 | 1,433 | 1.85% |
| Austin-Round Rock, TX MSA | 1,601 | 1,394 | -12.9% |
| Miami-Fort Lauderdale-Pompano Beach, FL | 1,300 | 1,359 | 4.54% |
| Olympia, WA | 1,265 | 1,337 | 5.69% |
| Orlando-Kissimmee, FL | 1,270 | 1,315 | 3.54% |
| Portland-Vancouver-Beaverton, OR-WA | 1,224 | 1,282 | 4.74% |
| Columbus, GA-AL | 1,013 | 1,258 | 24.2% |
| Sacramento-Arden-Arcade-Roseville, CA | 1,234 | 1,245 | 0.89% |
| Philadelphia-Camden-Wilmington, PA-NJ-DE-MD | 1,170 | 1,241 | 6.07% |
| Richmond, VA | 1,008 | 1,213 | 20.3% |
| Hinesville-Fort Stewart, GA | 734 | 1,210 | 64.8% |
| Nashville-Davidson-Murfreesboro-Franklin, TN | 1,252 | 1,208 | -3.51% |
| Anchorage, AK | 931 | 1,194 | 28.3% |
| Omaha-Council Bluffs, NE-IA | 1,236 | 1,154 | -6.63% |
| Detroit-Warren-Livonia, MI | 1,113 | 1,136 | 2.07% |
| Charlotte-Gastonia-Concord, NC-SC | 1,164 | 1,128 | -3.09% |

Related Posts
-
 VA Renovation Loans for Rehab & Home ImprovementVA rehab and renovation loans are the VA's answer to an aging housing market in the United States. Here we dive into this unique loan type and the potential downsides accompanying them.
 -
 Pros and Cons of VA LoansAs with any mortgage option, VA loans have pros and cons that you should be aware of before making a final decision. So let's take a closer look.


