Younger Veterans and service members continue to have an outsized impact on VA lending. Here's a look at cities where they're making a difference during what looks like another record year.
Halfway through Fiscal Year 2021, the historic VA loan program is poised to smash last year's record number of loans.
Millennial and Generation Z Veterans and service members are a big reason why.
These two demographics accounted for 52% of all VA purchase loans in the first half of FY21, up from 47% in the first half of last fiscal year, according to Department of Veterans Affairs data.
Younger Veterans and service members are also refinancing in waves, seizing lingering low rates to lock in lower payments or even tap into their home equity.
A few stats that help highlight the outsized role Millennial and Gen Z Veterans are playing in what may be another historic year for this benefit program:
- VA purchase loans for Generation Z Veterans were up a whopping 123% year over year.
- VA purchase loans for Millennial buyers were up 16%.
- VA refinance loans for Millennials were up 84% year over year.
Younger Veterans and service members continue to drive the growth of VA lending nationwide.
Here's a closer look at the top metro areas for VA purchase and refinance loans among Millennial and Generation Z Veterans and service members.
Top 35 Cities for Millennial and Gen Z VA Buyers
| MSA | FY20 Total Purchase Loans | FY21 Total Purchase Loans | % Difference |
|---|---|---|---|
| Virginia Beach-Norfolk-Newport News, VA-NC MSA | 3,533 | 4,761 | 34.76% |
| Washington-Arlington-Alexandria, DC-VA-MD-WV MSA | 2,685 | 3,650 | 35.94% |
| San Antonio, TX MSA | 2,107 | 2,571 | 22.02% |
| Colorado Springs, CO MSA | 1,994 | 2,329 | 16.80% |
| San Diego-Carlsbad-San Marcos, CA MSA | 1,790 | 2,165 | 20.95% |
| Dallas-Fort Worth-Arlington, TX MSA | 2,090 | 2,129 | 1.87% |
| Phoenix-Mesa-Scottsdale, AZ MSA | 1,772 | 1,900 | 7.22% |
| Riverside-San Bernardino-Ontario, CA MSA | 1,339 | 1,849 | 38.09% |
| Jacksonville, FL MSA | 1,351 | 1,672 | 23.76% |
| Houston-Sugar Land-Baytown, TX MSA | 1,466 | 1,645 | 12.21% |
| Fayetteville, NC MSA | 1,183 | 1,631 | 37.87% |
| Atlanta-Sandy Springs-Marietta, GA MSA | 1,388 | 1,602 | 15.42% |
| Clarksville, TN-KY MSA | 1,280 | 1,546 | 20.78% |
| Seattle-Tacoma-Bellevue, WA MSA | 1,433 | 1,517 | 5.86% |
| Killeen-Temple-Fort Hood, TX MSA | 1,156 | 1,488 | 28.72% |
| Jacksonville, NC MSA | 1,266 | 1,412 | 11.53% |
| Las Vegas-Paradise, NV MSA | 1,078 | 1,381 | 28.11% |
| Tampa-St. Petersburg-Clearwater, FL | 1,118 | 1,358 | 21.47% |
| Baltimore-Towson, MD MSA | 1,091 | 1,317 | 20.71% |
| Chicago-Naperville-Joliet, IL-IN-WI MSA | 963 | 1,247 | 29.49% |
| Pensacola-Ferry Pass-Brent, FL MSA | 833 | 1,082 | 29.89% |
| Denver-Aurora, CO MSA | 978 | 1,025 | 4.81% |
| St. Louis, MO-IL MSA | 740 | 991 | 33.92% |
| Fort Walton Beach-Crestview-Destin, FL MSA | 892 | 974 | 9.19% |
| El Paso, TX MSA | 682 | 954 | 39.88% |
| Honolulu, HI MSA | 726 | 948 | 30.58% |
| Los Angeles-Long Beach-Santa Ana, CA MSA | 730 | 893 | 22.33% |
| Augusta-Richmond County, GA-SC MSA | 734 | 876 | 19.35% |
| Oklahoma City, OK MSA | 794 | 866 | 9.07% |
| Charleston-North Charleston, SC MSA | 663 | 815 | 22.93% |
| Tucson, AZ MSA | 581 | 760 | 30.81% |
| Minneapolis-St. Paul-Bloomington, MN-WI MSA | 712 | 736 | 3.37% |
| Columbia, SC MSA | 534 | 706 | 32.21% |
| Austin-Round Rock, TX MSA | 693 | 702 | 1.30% |
| Kansas City, MO-KS MSA | 613 | 677 | 10.44% |
Top 35 Cities for Millennial and Gen Z VA Refinance
| MSA | FY20 Total Refinance Loans | FY21 Total Refinance Loans | % Difference |
|---|---|---|---|
| Washington-Arlington-Alexandria, DC-VA-MD-WV MSA | 3,203 | 6,757 | 110.96% |
| Virginia Beach-Norfolk-Newport News, VA-NC MSA | 2,666 | 5,564 | 108.70% |
| San Diego-Carlsbad-San Marcos, CA MSA | 2,986 | 4,981 | 66.81% |
| Phoenix-Mesa-Scottsdale, AZ MSA | 2,282 | 3,563 | 56.13% |
| Colorado Springs, CO MSA | 2,222 | 3,458 | 55.63% |
| Riverside-San Bernardino-Ontario, CA MSA | 2,138 | 3,331 | 55.80% |
| Seattle-Tacoma-Bellevue, WA MSA | 1,878 | 3,121 | 66.19% |
| San Antonio, TX MSA | 1,356 | 2,847 | 109.96% |
| Dallas-Fort Worth-Arlington, TX MSA | 1,542 | 2,726 | 76.78% |
| Baltimore-Towson, MD MSA | 1,130 | 2,430 | 115.04% |
| Denver-Aurora, CO MSA | 1,514 | 2,240 | 47.95% |
| Los Angeles-Long Beach-Santa Ana, CA MSA | 1,309 | 2,239 | 71.05% |
| Honolulu, HI MSA | 994 | 2,056 | 106.84% |
| Houston-Sugar Land-Baytown, TX MSA | 991 | 2,045 | 106.36% |
| Atlanta-Sandy Springs-Marietta, GA MSA | 1,179 | 1,915 | 62.43% |
| Chicago-Naperville-Joliet, IL-IN-WI MSA | 1,061 | 1,902 | 79.26% |
| Las Vegas-Paradise, NV MSA | 1,198 | 1,886 | 57.43% |
| Jacksonville, FL MSA | 830 | 1,780 | 114.46% |
| Tampa-St. Petersburg-Clearwater, FL | 885 | 1,620 | 83.05% |
| Minneapolis-St. Paul-Bloomington, MN-WI MSA | 884 | 1,577 | 78.39% |
| Fayetteville, NC MSA | 639 | 1,489 | 133.02% |
| Portland-Vancouver-Beaverton, OR-WA MSA | 784 | 1,301 | 65.94% |
| Sacramento-Arden-Arcade-Roseville, CA MSA | 786 | 1,288 | 63.87% |
| St. Louis, MO-IL MSA | 633 | 1,216 | 92.10% |
| Clarksville, TN-KY MSA | 577 | 1,137 | 97.05% |
| Jacksonville, NC MSA | 504 | 1,133 | 124.80% |
| Tucson, AZ MSA | 606 | 1,092 | 80.20% |
| Philadelphia-Camden-Wilmington, PA-NJ-DE-MD MSA | 505 | 1,072 | 112.28% |
| Kansas City, MO-KS MSA | 563 | 989 | 75.67% |
| Olympia, WA MSA | 590 | 967 | 63.90% |
| Miami-Fort Lauderdale-Pompano Beach, FL MSA | 617 | 965 | 56.40% |
| Indianapolis-Carmel, IN MSA | 513 | 962 | 87.52% |
| Detroit-Warren-Livonia, MI MSA | 570 | 956 | 67.72% |
| Charleston-North Charleston, SC MSA | 548 | 951 | 73.54% |
| Nashville-Davidson-Murfreesboro-Franklin, TN MSA | 564 | 938 | 66.31% |

Related Posts
-
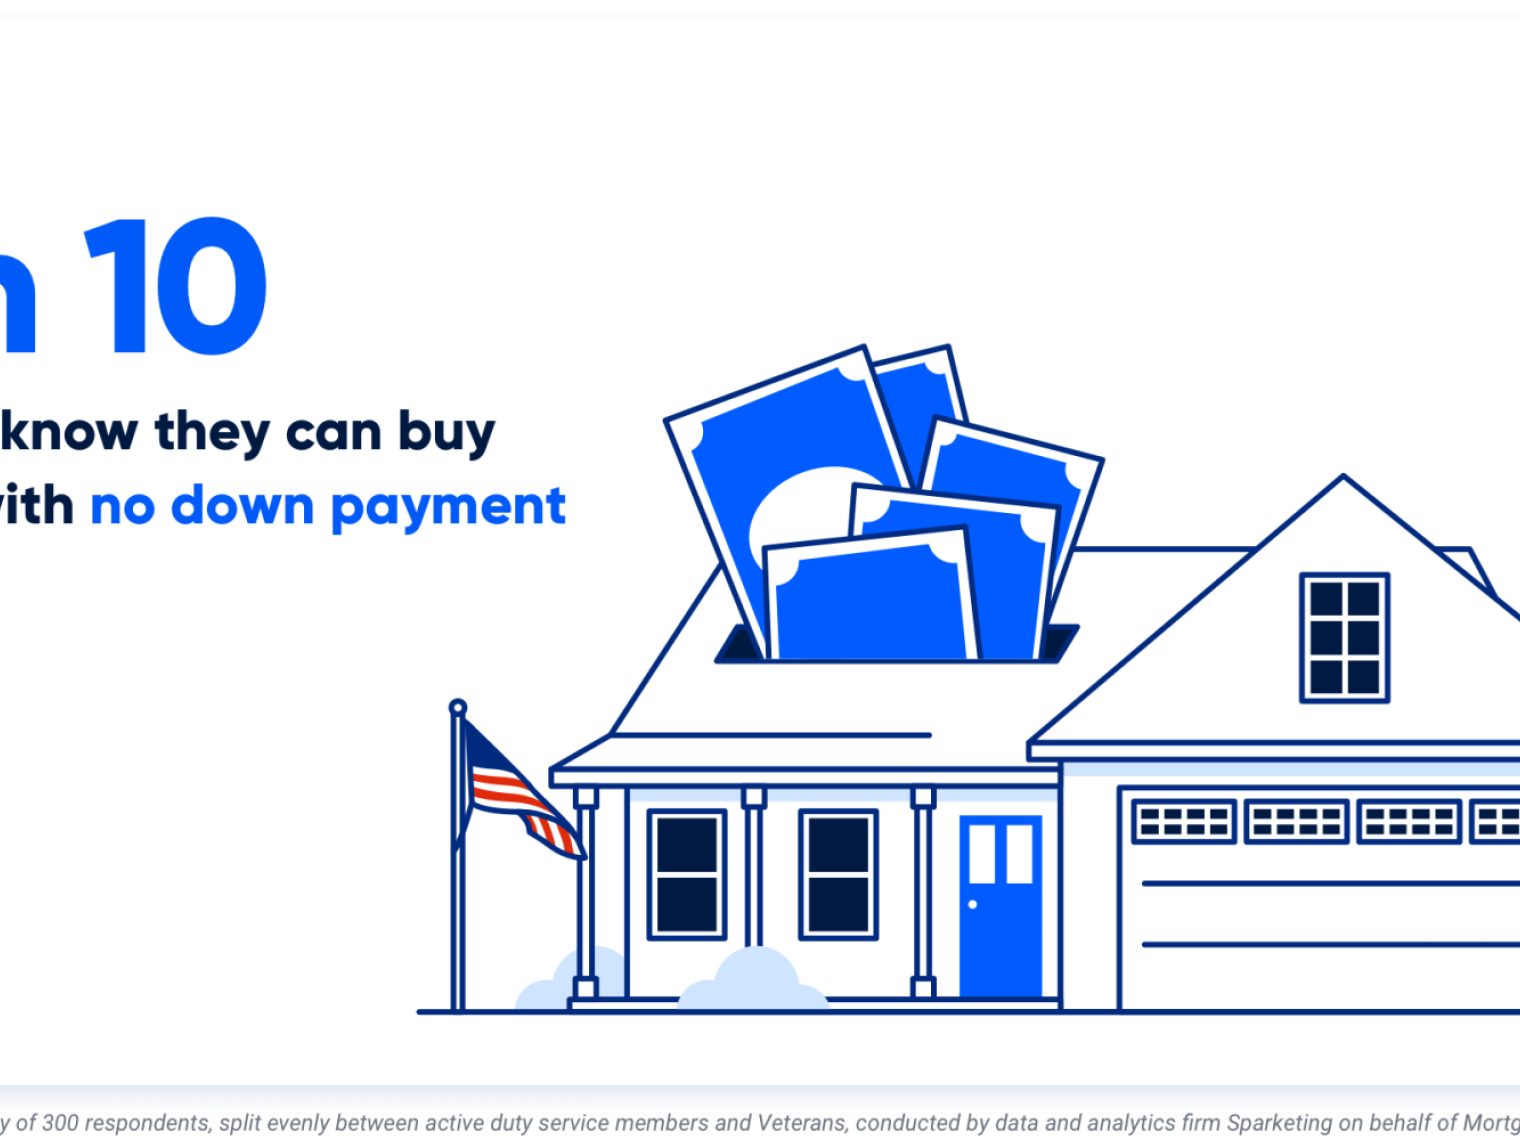 VA Loan Down Payment RequirementsVA loans have no down payment requirements as long as the Veteran has full entitlement, but only 3-in-10 Veterans know they can buy a home loan with zero down payment. Here’s what Veterans need to know about VA loan down payment requirements.
 -
 5 Most Common VA Loan Myths BustedVA loan myths confuse and deter many VA loan borrowers. Here we debunk 5 of the most common VA loan myths so that you can borrow with confidence.


